Consensus Scoring Methods: Lessons from the French Revolution

Written and edited by Sherman Charles
Graphic by Cleidson da Silva
According to the academic literature dedicated to scoring methods, converting Raw Scores (i.e. Absolute Scores) to Ranks (i.e. Relative Scores) helps eliminate issues associated with point spread and some of the ability for a single judge to throw a competition (i.e. Strategic Voting). What to do with these ranks has been a hotly contested topic at least since the days of the French Revolution in the late 18th century. Today, how final results are calculated from Ranks is debated not just among competitors and competition directors, but also in peer-reviewed journals, theses, and other academic sources. Unfortunately, much of the scholarly side of the debate is hidden and inaccessible to the world of competitive arts and this has a substantial impact on how results for competitions are determined. Many of the methods that are currently used are outdated, clunky, obtuse, misinformed, and quite frankly, biased. While I do not claim to be an authority on scoring for the competitive arts, I do consider myself an expert. That is to say, my intent is not to determine how results should be calculated, but rather to inform competition directors on the most effective and ethical methods available. Thus, hopefully this blog post and others in this series will help demystify some of the most commonly used scoring methods, shed light on their strengths and weaknesses, and start a movement toward the use of better, more mathematically sound scoring methods. Ultimately, the choice is the director’s to make.
Consensus
For more than a decade now, I have been tabulating for competitions all over the US and I have come across countless approaches to scoring. At times, one person’s idea of what scoring should be is vastly different from the next; so much so that there appears to be some disagreement as to what constitutes Consensus Scoring. Unfortunately, this is the root of much of the confusion out there, so let’s start by clearing up what exactly Consensus is.
The definition of Consensus provided by the online Merriam-Webster Dictionary is…
1a: general agreement
1b: the judgment arrived at by most of those concerned
2: group solidarity in sentiment and belief
…and this is how it is defined for the purposes of this blog post. To be clear, Consensus is not treated as synonymous with Unanimous, specifically because there is often discord between a panel of judges due to their differences in subjective interpretations of the competing performances. Not all judges agree 100% of the time. Importantly, though, this isn’t to say that even with discord there isn’t Consensus. It is in fact there – you just have to find it.
The goal of good scoring methods should be objectively finding patterns of agreement among the judges. Although this sounds relatively simple, calculating this is not as easy as it may seem. In order to find out how to do this, we need to look back as far as the French Revolution. No, I’m not talking about methods for decapitating the monarchy, nor the most efficient way to become Emperor. I’m talking about how to best represent the will of an entire group rather than just a few.
In the following sections I present the strengths and weaknesses of two methods: The Consensus Ordinal Ranking Method and a subset of Condorcet Methods. Condorcet Methods—as far as I can tell—have not made it into the competitive arts, so I am taking this opportunity to introduce them to you. In this post, I pay particular attention to whether or not each method actually calculates Consensus. At the end, I provide a summary of the details. It is a dense discussion, but I hope I have made everything as clear as possible. Feel free to comment and ask questions below.
Consensus Ordinal Ranking Method
The method that is most widely used in the showchoir world is known as the Consensus Ordinal Ranking Method, the Fair Fehr Method, or something of the like. It is based on the 6.0 scoring system that was used in Olympic Figure Skating until after the 2002 Winter Olympics scandal. According to the 2018 Johnston Showzam Director’s Handbook, this method was designed to remove the influence of point swings in Raw Scores and Ranks on the final results. It is supposed to prevent a single judge from throwing a competition and ensure that the Participant with the most 1s wins. This loosely fits into the category of plurality electoral systems – not unlike how the US Electoral College elects the president. There is no need for a majority to win. The candidate with the most winning votes takes the prize.
Let’s look at the example that I used in the previous post, Raw Scores vs. Ranks, which was taken from the 2018 Johnston Showzam Director’s Handbook with some modifications for clarity.
Figure 1: Scenario 1 – Raw Scores

Participants are listed in the first column and the judges are listed in the first row. The last two columns correspond to the sum of all Raw Scores awarded to each participant and the final Place that they would receive. This figure demonstrates that if the results were calculated by Raw Scores, School B would win, even though the majority of the judges have School A in first place.
Figure 2: Scenario 1 – Borda count Method

Participants are listed in the first column and the judges are listed in the first row. The last two columns correspond to the sum of all Ranks awarded to each participant and the final Place that they would receive. This figure demonstrates that if the results were calculated by the Borda count Method, School B would win, even though the majority of the judges have School A in first place.
In this scenario, more judges had School A in first, but by both Raw Scores (Figure 1) and by the Borda Count Method (Figure 2) (see the Footnote below for explanation of the Borda Count Method), School B wins. However, if we use the Consensus Ordinal Ranking Method as described by multiple Director’s Handbooks from showchoir competitions around the US, School A wins simply because they have the most 1s (Figure 3). As a quick note, I have seen a few other strategies for calculating the same results (e.g. subtraction rather than tallying), but for simplicity, I will not be describing or using them in this post.
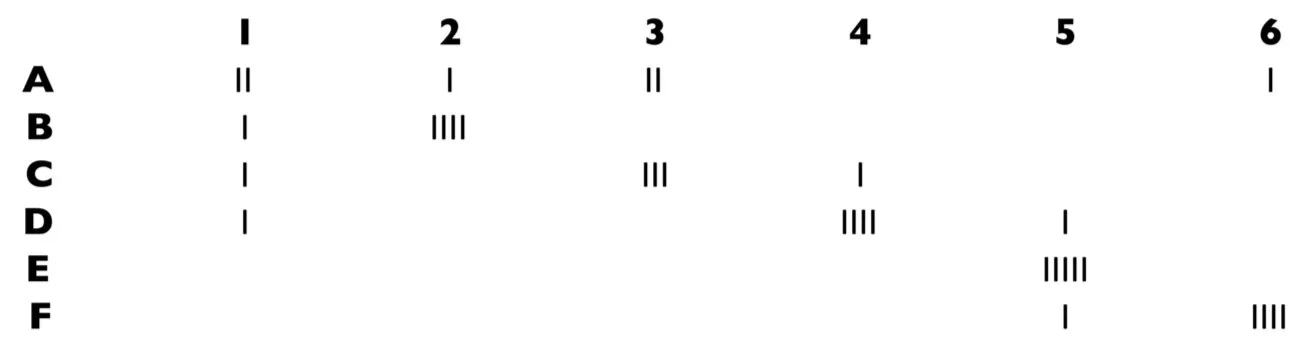
Figure 3: Scenario 1 – Consensus Ordinal Ranking Method

Participants are listed in the first column and places are listed in the first row. Each tick mark represents a single place vote corresponding the the judges’ ranks. For example, School A received three 1’s, one 2, and one 6. This figure shows that if the results were calculated by the Consensus Ordinal Ranking Method, School A would win because they have the most first place rankings from the judges.
In this particular case, this method allows for the majority to rule and prevents Judge 4 from manipulating the results in the favor of their preferred Participant. In short, it was successful at finding the Plurality among the panel of judges. Raw Scores and the Borda Count Method were unable to do this. While on the surface the Consensus Ordinal Ranking Method seems like the fairest and most logical method for calculating results, it is not ideal. Let’s look at the following example:
Figure 4: Scenario 2 – Raw Scores

Participants are listed in the first column and the judges are listed in the first row. The last two columns correspond to the sum of all Raw Scores awarded to each participant and the final Place that they would receive. This figure shows that if the results were calculated by Raw Scores, School B would win, even though more judges have School A in first place.
Figure 5: Scenario 2 – Borda count Method

Participants are listed in the first column and the judges are listed in the first row. The last two columns correspond to the sum of all Ranks awarded to each participant and the final Place that they would receive. This figure shows that if the results were calculated by the Borda Count Method, School B would win, even though more judges have School A in first place.
Figure 6: Scenario 2 – Consensus Ordinal Ranking Method
This figure shows that if the results were calculated by the Consensus Ordinal Ranking Method, School A would win because they have the most 1’s.
This is a similar situation where the School with the most 1s does not win unless the Consensus Ordinal Ranking Method is employed. However, the majority of the judges (3 out of the 5), do not have School A winning. In fact, most of the judges (Judges 3, 4, and 5) have School B ranked higher than School A. So in this case, only two judges (less than half of the total) decided the outcome of this competition. This is problematic, especially if this method is supposed to find Consensus among the judges. The majority of the judges agree that School B should be ranked higher than School A, but this agreement is not reflected in the final results calculated by the Consensus Ordinal Ranking Method. Luckily, there is a method that was initially developed by Marquis de Condorcet—an 18th century French mathematician and philosopher—that solves this problem.
Condorcet Method
The Condorcet Method tries to find the Participant who wins over all other Participants in head-to-head contests (Tideman 1987). To do this, each Participant needs to be compared to all of the other Participants, one-by-one. Let’s take the previous example again. Between School A and School B, who would come in first?
Figure 7: Scenario 2 – Raw Scores for just School A and School B

Participants are listed in the first column and the judges are listed in the first row. This figure displays the Ranks of just School A and School B.
In this head-to-head contest, School B is ranked higher than School A three times, whereas School A is ranked higher than School B only 2 times. Therefore, in this contest, School B wins. To determine the rest of the final places, this step is repeated for each paring of all Participants. The winners of each head-to-head contest are underlined below.
A v. B
A v. C
A v. D
A v. E
A v. F
B v. C
B v. D
B v. E
B v. F
C v. D
C v. E
C v. F
D v. E
D v. F
E v. F
The Participant that wins the most head-to-head contests wins overall. The second most receives second place, the third most receives third place, and so on and so forth. This is what the final outcome would be.
1st Place - School B with 5 wins
2nd Place - School A with 4 wins
3rd Place - School C with 3 wins
4th Place - School D with 2 wins
5th Place - School E with 1 win
6th Place - School F with 0 wins
Figure 8: Scenario 2 – Condorcet Method

Participants are listed in the first column and the first row. At each intersection of a row and a column, a “1” represents a win and a “0” represents a loss. For example, where the row for School A intersects with the column for School B there is a “0” indicating that School A lost to School B. The last two columns correspond to the sum of all wins awarded to each participant (by row) and the final Place that they would receive. This type of chart is known as a Pairwise Matrix. This figure shows that if the results were calculated by the Condorcet Method, School B would win, even though more judges have School A in first place.
While more judges have School A in first place, School B was ranked higher than School A by more judges, which suggests the Consensus among the judges is that School A should not be ranked above School B in the final outcome. The Condorcet Method is an objective way to calculate group agreement. The Consensus Ordinal Ranking Method cannot capture this since one of its main deciding factors is plurality of same high ranks rather than agreement among the judges.
Summary
In sum, the Consensus Ordinal Ranking Method is great at what it was designed to do. It prevents a single judge from throwing a competition and calculates results based on a plurality. However, it does this by explicitly eliminating low Ranks that are deviant from the plurality. This effectively nullifies certain judges’ low Ranks altogether, even if they are the majority. Therefore, it does not reach a global consensus of all Ranks from all judges. Instead, it favors high ranks as long as more than one judge is in agreement. With this method, only two judges are needed to decide the winner, as long as the other judges do not agree on who should be in first. This implies that not all judges’ opinions are equal, especially if it does not favor a specific Participant.
This leaves a gap in the methods that can be exploited by mathematically savvy judges. If a single judge wants to prevent a certain School from winning, all they have to do is make sure their 1st place candidate is the same as another judge’s 1st place candidate and voilà, they have successfully thrown the competition.
In reality, the Consensus Ordinal Ranking Method is a misnomer. It does not find Consensus (and, for you nerds out there, it does not use Ordinals, it uses Intervals!). It should be called something like the High Plurality Rules Method, but who cares, right?
The Condorcet Method considers all Ranks by all judges to gain an overall, global representation. This Consensus seeking method and its variants are used in a wide variety of fields, including real elections and public opinion polls. They assume that all judges are equal and all Ranks are used for computing overall results—including deviant outliers—resulting in a more accurate representation as a whole. Instead of giving weight to high ranks and plurality to prevent a rogue judge (a.k.a. a strategic voter) from determining the final results, Consensus is the single most important factor. The single rogue judge has no power. The Consensus Ordinal Ranking Method can only do this if more than one judge has the same Participant in the same Rank.
Another advantage that the Condorcet Method has is the longstanding history and support from experts in the area of voting theory. Its definition is clear and concise, making it easy to understand, explain, and standardize across competition circuits. To the best of my knowledge, the Consensus Ordinal Ranking Method doesn't exist outside of the showchoir world, which in itself should raise questions about its validity.
Part of my job with Carmen Scoring is to provide a system that is flexible enough to accommodate the wide variety of scoring methods that are used out there yet rigid enough to ensure the results are as fair and representative as possible. Therefore, for the 2020 competition season, we will be providing a total of five scoring method options: Raw Scores, Borda Count, Consensus Ordinal Ranking, Condorcet: Ranked Pairs, and Condorcet: Schultze. Although we highly recommend either of the Condorcet Methods in every case, it is ultimately the competition’s decision to make, which is why we are making each of them available.
Try It Yourself
If you would like to try your hand at the Condorcet Method, see if you can figure out the results from the following Raw Scores. Compare it to the results from using the Consensus Ordinal Ranking Method. To find the answers, click here.

Participants are listed in the first column and the judges are listed in the first row. This figure displays the Raw Scores for a third scenario. Try to figure out the results using the Condorcet Method described above.
Footnote
The Borda count Method was developed by the French mathematician and engineer, Jean-Charles de Borda (1784). This is a method for calculating results based on preferential ranks. The ranks are simply added together and the winner will have the lowest total. It’s the same as taking the average of each choir’s rank and the lowest average wins. However, this method is subject to manipulation by a single judge. All they have to do is inflate or deflate their scores to rank the would be winner as low as possible. This is known in field of statistics as failure to meet Clone Independence, i.e. a rogue judge can strategically manipulate their scores to prevent a particular choir from winning. Additionally, it is prone to ties that must be broken by Raw Score. Although it’s simple and easy to understand, it isn’t the best choice. Even if you trust your judges, this might not give you the best, most representative results.
References
Borda, J.-C. 1784. Mémoire sur les Élections au Scrutin, in Historie de l’Académie Royale des Sciences anneé 1781, Paris, France.
Tideman, T. N. 1987. Independence of clones as a criterion for voting rules. Social Choice and Welfare 4, 185-206.